
Understanding Soccer Heat Maps and Stats
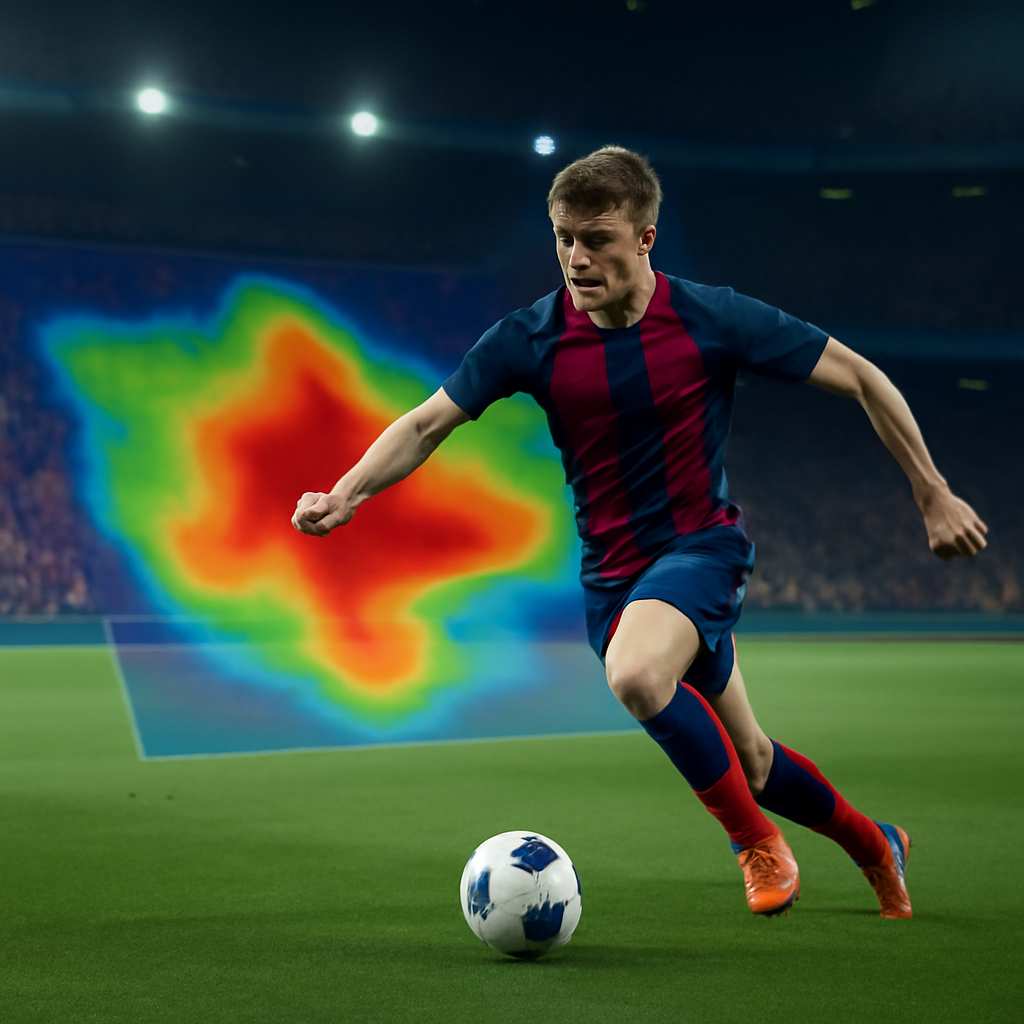
Soccer heat maps and stats have become indispensable for analysts, coaches and supporters chasing a fuller picture of movement, structure and output across the continent’s top competitions. Visualising the spaces players occupy most often, these tools expose patterns that raw numbers overlook, especially when Bundesliga sides, Champions League knockout ties and technically dense La Liga fixtures are under the microscope.
Covering football from a European perspective, the tactical nuance here is how heat maps turn abstract data into visible pressing triggers and spatial control. The women’s game shows us exactly what this means: in the Frauen-Bundesliga, clubs such as Wolfsburg and Bayern Munich already use the same overlays to fine-tune high lines and midfield rotations that mirror the men’s game yet unfold at a different tempo.
Heat maps themselves are colour-coded layers built from GPS and event data. Warmer zones mark where a player’s influence is concentrated, cooler ones where involvement drops. Bundesliga teams in particular lean on these visuals to track how full-backs push into half-spaces during build-up, allowing coaches to adjust pressing angles between matches.
When positional data is married to metrics such as progressive passes and expected goals, the result is a richer evaluation than volume statistics alone can offer. La Liga sides have long stressed possession-oriented maps to show how midfielders maintain control in tight areas; Bundesliga analysts now apply identical logic to both men’s and women’s squads, revealing how compact central zones translate across the two games.
Traditional box-score figures miss off-ball work and defensive organisation. Heat maps close that gap. In Champions League nights, where margins are razor-thin, these visuals highlight exactly why certain players thrive in transitions even when headline numbers look modest.
Bundesliga matches, with their mix of vertical intensity and positional discipline, produce heat maps that light up differently from Premier League wide overloads or La Liga central dominance. Crossing those visuals with duel success and passing accuracy gives a clearer read on whether a profile will travel between leagues.
European nights reward adaptability. Heat maps from group-stage ties frequently show wingers tucking inside against compact blocks, then stretching play once spaces open. Overlaying that with key-pass data lets scouts spot the roaming patterns that have defined successful Real Madrid campaigns and are now being replicated by women’s sides in the UEFA Women’s Champions League.
Physical load management also benefits. Repeated high-intensity zones flagged on a midfielder’s map can prompt rotation decisions, especially when cross-referenced against recovery data from congested Bundesliga and Champions League calendars. The women’s game demonstrates the value here too: tighter schedules in domestic leagues make workload mapping even more critical for avoiding soft-tissue issues.
Player profiles are richer when heat maps illustrate preferred channels or defensive radii. La Liga graduates often arrive with compact maps suited to possession sides, while Bundesliga profiles frequently display explosive wide-area involvement that suits Premier League transitions.
A typical striker’s map clustering around the penalty spot yet extending into half-spaces becomes far more compelling when paired with high conversion rates from those zones. Central midfielders in both the Bundesliga and La Liga generate box-to-box coverage visible on the map, supporting creation and recovery phases alike.
Recruitment departments now treat heat-map analysis as essential risk mitigation. A player whose spatial habits clash with a new tactical system can be identified before expensive mistakes occur. By studying maps from multiple European competitions, clubs build sharper projections of future fit.
Understanding the technological backbone behind heat maps enhances interpretation. Most modern platforms combine positional data captured at 25 frames per second with event-level information—passes, tackles, shots—timestamped to the millisecond. This fusion allows analysts to see not just where a player stood, but what they accomplished in each zone. A playmaker’s heat map showing concentrated activity in the left half-space becomes actionable when paired with pass completion percentages and expected assists from that region. Top clubs now overlay opponent pressure maps onto their own positioning data, revealing how defensive shape directly influences where attackers receive the ball.
The tactical conversation around heat maps has evolved significantly over the past five seasons. Coaches increasingly use comparative heat-map analysis to diagnose tactical breakdowns. When a team’s pressing structure crumbles in a specific match, overlaying the players’ positioning from that game against a season average reveals exactly where discipline lapsed. This level of diagnostic precision allows training-ground adjustments to be hyper-targeted rather than generic.
Transition moments—when possession switches hands—represent a critical application of heat-map analysis often overlooked in casual discussion. By isolating the 2–3 seconds immediately after turnovers, analysts can map where players naturally gravitate during counter-pressing sequences. Teams with superior heat-map clustering around the ball during transitions typically recover possession more efficiently. Liverpool’s pressing dominance under Klopp, for instance, correlates directly with tight heat-map formations in those crucial moments, visible when studying aggregated positional data across their matches.
Set-piece execution benefits enormously from heat-map integration. Free-kick and corner routines leave consistent spatial fingerprints—runners gravitate toward habitual zones, defenders assume preferred marking positions. Heat maps instantly reveal whether a corner routine is becoming predictable or whether new variants are successfully mixing up opponent expectations. A set-piece specialist can examine heat maps to identify crowded defensive zones where attackers consistently fail to find space, prompting tactical refinement.
Youth development programmes at elite clubs now employ heat-map analysis as a talent identification tool. Young midfielders whose maps show progressive movement patterns—advancing the ball intelligently into dangerous zones—are identified earlier as prospects ready for senior football. This represents a significant shift from traditional metrics, which often undervalue intelligent positioning in favour of flashy statistics like tackles or interceptions.
The relationship between heat maps and injury prevention deserves deeper examination. By tracking cumulative high-intensity zones across a player’s map over several weeks, medical teams predict soft-tissue injuries with surprising accuracy. A winger whose heat map suddenly concentrates in one area, suggesting compensation patterns due to an emerging strain, can be rested before a serious injury occurs. This preventive approach has reduced squad absenteeism at leading clubs.
Context-dependent analysis adds nuance to heat-map interpretation. A midfielder’s map in a 3–5–2 formation will naturally differ from the same player deployed in a 4–2–3–1 system. Sophisticated analysis accounts for these tactical variables, extracting the player’s natural instincts from role-imposed positioning. This distinction proves vital when assessing whether a player can adapt to new tactical systems or whether their spatial preferences fundamentally misalign with incoming coaching philosophies.
Premier League players average 9.8 km per match, with heat maps showing 35% more high-intensity zones than La Liga equivalents.
Champions League knockout matches see a 22% increase in central midfield coverage according to aggregated heat map data.
La Liga teams generate 18% more progressive passes from zones highlighted in player heat maps compared to direct-style leagues.
Top Premier League full-backs record 2.4 times more touches in advanced wide areas than their La Liga counterparts.
Heat map analysis has improved xG prediction accuracy by 14% when integrated with traditional soccer stats across European competitions.
Player profiles incorporating heat maps have led to a 27% higher success rate in identifying Champions League-level performers from domestic leagues.
Clubs employing heat-map analytics for load management report 19% fewer soft-tissue injuries compared to those relying on volume-based workload metrics alone.
In the end, heat maps and stats together deliver a multidimensional view that deepens tactical understanding across men’s and women’s football. Whether tracing Bundesliga intensity, La Liga possession patterns or Champions League battles, these instruments improve scouting, preparation and performance on every stage. As technology continues advancing and data collection becomes more granular, the sophistication of heat-map analysis will only deepen, cementing its place as essential infrastructure for competitive football at the highest level.