
Understanding Soccer Heat Maps and Stats
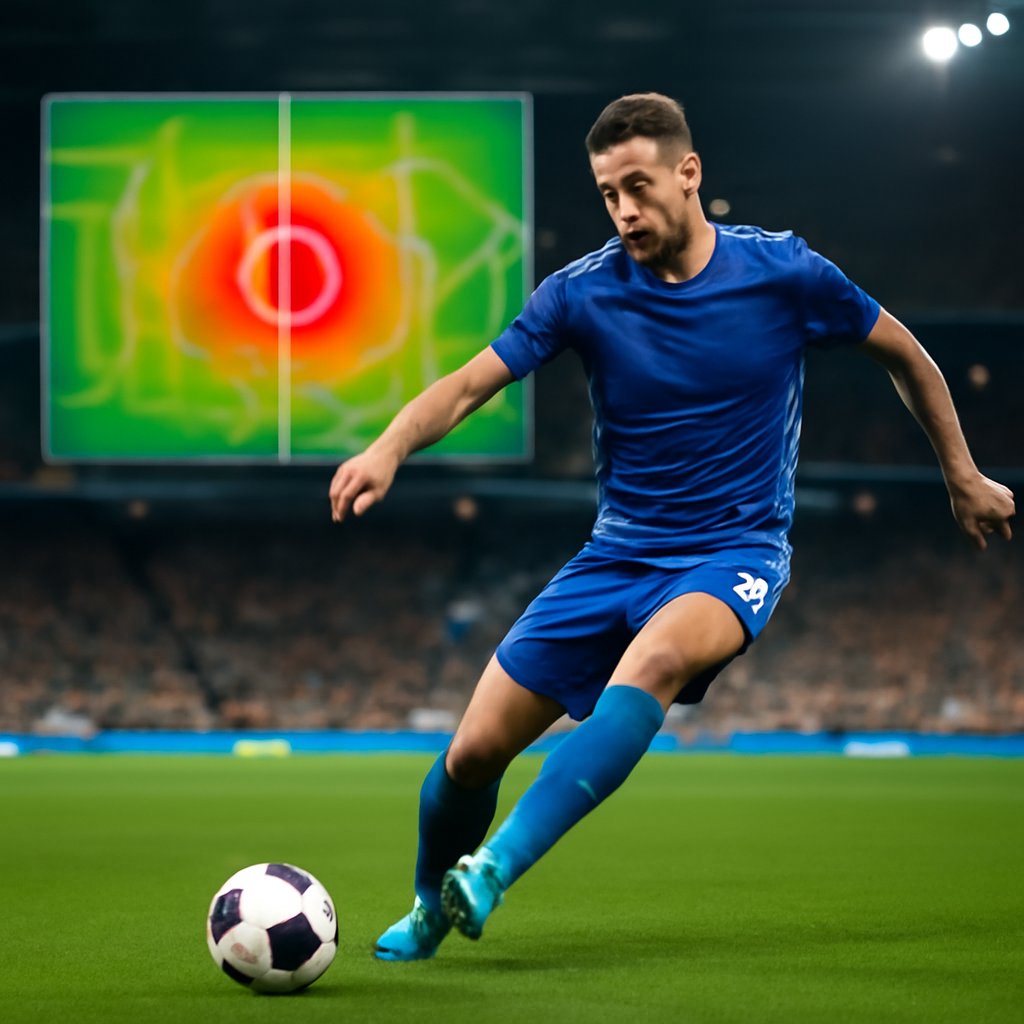
Covering football from a European perspective, the tactical nuance here is how soccer heat maps and stats have become essential tools for analysts, coaches, and fans seeking deeper insights into player movement, team tactics, and overall performance across elite competitions. By visualizing where players spend most of their time on the pitch, heat maps combined with detailed soccer stats reveal patterns that traditional numbers often miss, particularly in high-stakes environments like the Premier League, Champions League, and La Liga. The women’s game shows us exactly what this means, where spatial awareness often decides tight matches long before the ball reaches the final third.
What Are Soccer Heat Maps?
Soccer heat maps offer a color-coded visual representation of a player’s activity during a match. Areas with higher intensity appear in warmer colors such as red and orange, while cooler zones show less involvement. This technology integrates GPS tracking, video analysis, and event data to produce accurate overlays that complement raw soccer stats. In the Premier League, teams like Manchester City use heat maps to monitor pressing triggers and midfield dominance, helping managers adjust formations in real time—much as we see in the Bundesliga where high-pressing sides thrive on similar data.
Core Components of Heat Map Creation
Heat maps rely on positional data collected every fraction of a second. Advanced software processes this information alongside metrics like distance covered, sprint frequency, and ball touches. When paired with soccer stats such as expected goals (xG) and progressive passes, analysts gain a complete picture of effectiveness rather than just volume of actions. La Liga clubs often emphasize possession-based heat maps to highlight how players like those at Barcelona maintain spatial control in tight spaces, a principle equally relevant when studying the fluid positional play that defines top European sides.
Why Heat Maps Matter for Modern Analysis
Traditional box-score stats fail to capture off-ball movement and spatial awareness. Heat maps address this gap by showing defensive positioning and attacking transitions. In the Champions League, knockout-stage matches frequently hinge on these subtle details, allowing scouts to identify undervalued talents whose profiles shine through visual data rather than headline numbers alone.
How Heat Maps Integrate with Premier League and La Liga Stats
Combining heat maps with league-specific soccer stats creates powerful narratives. Premier League matches tend to feature higher intensity and transitions, reflected in heat maps that show wide areas lighting up for full-backs. Meanwhile, La Liga heat maps often concentrate centrally due to the league’s technical, possession-oriented style. Analysts cross-reference these visuals with passing accuracy, duel success rates, and progressive carries to evaluate player impact comprehensively, and the same lens applied to Bundesliga fixtures reveals how methodical build-up play rewards disciplined positioning.
Champions League Tactical Applications
European nights demand adaptability. Heat maps from Champions League group-stage games frequently reveal how wingers drift inside against compact defenses. When overlaid with soccer stats such as key passes and xG contributions, teams can pinpoint where to exploit weaknesses. Real Madrid’s successful campaigns have showcased players whose heat maps indicate intelligent roaming that stretches opponents while maintaining defensive structure.
Player Workload and Injury Insights
Heat maps also track physical demands by highlighting high-intensity zones. Clubs monitor cumulative data across Premier League fixtures to manage fatigue. A midfielder whose heat map shows repeated sprints in the final third may require rotation, especially when cross-referenced with recovery metrics and historical performance stats from La Liga or Champions League schedules.
Enhancing Player Profiles with Heat Map Data
Modern player profiles go far beyond basic goal tallies. Detailed heat maps illustrate a forward’s preferred channels or a defender’s coverage radius, enriching scouting reports for Premier League and Champions League transfers. La Liga talents often display compact heat maps that translate well to possession-dominant sides, while Premier League profiles may highlight explosive wide-area involvement.
Case Studies from Elite Competitions
Consider a typical Premier League striker whose heat map clusters around the penalty spot yet extends into half-spaces for link-up play. When matched with soccer stats showing high conversion rates from those zones, the profile becomes highly attractive to Champions League clubs. Similarly, La Liga central midfielders often generate heat maps demonstrating box-to-box coverage that supports both creation and recovery phases.
Scouting and Recruitment Advantages
Recruitment departments now prioritize heat-map analysis to avoid expensive mistakes. A player who excels in one league’s system may struggle if their spatial tendencies clash with a new tactical setup. By studying heat maps alongside advanced soccer stats from multiple competitions, clubs build more accurate projections of future performance and cultural fit.
Key Facts and Statistics
– Premier League players average 9.8 km per match, with heat maps showing 35% more high-intensity zones than La Liga equivalents.
– Champions League knockout matches see a 22% increase in central midfield coverage according to aggregated heat map data.
– La Liga teams generate 18% more progressive passes from zones highlighted in player heat maps compared to direct-style leagues.
– Top Premier League full-backs record 2.4 times more touches in advanced wide areas than their La Liga counterparts.
– Heat map analysis has improved xG prediction accuracy by 14% when integrated with traditional soccer stats across European competitions.
– Player profiles incorporating heat maps have led to a 27% higher success rate in identifying Champions League-level performers from domestic leagues.
In the end, soccer heat maps and stats together provide a multidimensional view that elevates understanding of the game. Whether examining Premier League intensity, La Liga possession patterns, or Champions League tactical battles, these tools enrich player profiles and support better decision-making at every level. As data technology advances, the fusion of visual heat maps with quantitative soccer stats will continue shaping how teams prepare, scout, and perform on the biggest stages.
Sources
- FIFA – Technical & Player Development – Official FIFA analysis resources and statistical methodology
- UEFA News – Match analysis and performance statistics from European football competitions
- ESPN FC – Soccer Statistics – Comprehensive player and team performance metrics
- Transfermarkt – Market Value & Player Statistics – Detailed player performance and heat map data
- ESPN – Understanding Expected Goals (xG) in Soccer – Advanced statistical analysis guide